Calculating Rolling Herd Average Milk Production
with QuickBooks
Keeping the records needed for calculating rolling average milk
production is easy in QuickBooks. It does not, however, provide the
necessary reports--for that you'll need the ManagePLUS
for QuickBooks add-on. This article describes how to set up and
use QuickBooks along with ManagePLUS for reporting monthly average
and twelve-month rolling average milk production, based on actual
milk sales.
Overview
The most important step is setting up a main (parent) class for
the milk sales portion of your dairy enterprise, plus twelve
subclasses to represent the months of the year. As you enter each
milk check you assign the appropriate month's subclass.
Before generating reports, you update ManagePLUS with the number
of cows in your herd during the most recent month. (ManagePLUS
provides space for this in the Class list). You also enter the
average number of cows in the herd for the entire twelve-month
period covered by the report.
Finally, you can prepare the report by filtering it to include
only transactions for the most recent twelve months. This is what
allows the report to provide a rolling average: it is
always based on the most recent twelve months of production.
Accounts
No special setup is required for accounts. However, for this
example we'll assume milk income is posted to a subaccount of Sales,
called Milk Sales:
Setting Up Classes
How you set up and use classes is the key to getting reports of
monthly average milk production, and also determines how easily
you'll be able to calculate a rolling average.
QuickBooks: Set up your class list with a section
like the following. The class names you use may be different, but
you at least need (1) a parent class which represents milk
production in your dairy enterprise, and (2) twelve subclasses--one
for each month of the year. (Note that the parent class does not
have to be a top-level class: it may be a subclass of some
other parent class.)
- Milk
- Jan
- Feb
- Mar
- Apr
- May
- Jun
- Jul
- Aug
- Sep
- Oct
- Nov
- Dec
Entering Milk Sales Income
Each time you enter a milk check, assign a class representing the
appropriate production month. This will allow ManagePLUS to provide
monthly average production statistics when you generate reports.
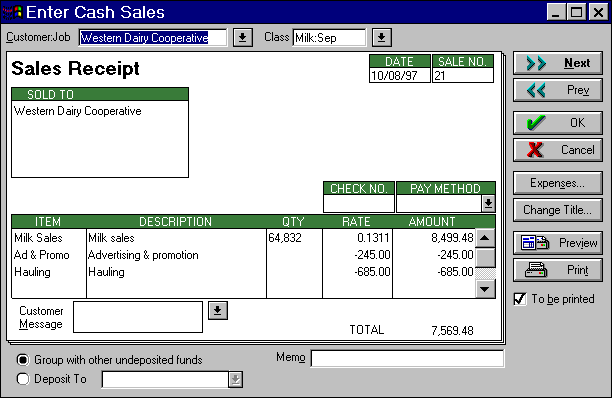
QuickBooks: The following example shows entry of a
milk check, and deductions as a cash sale. The income will be posted
to the Milk Sales account, because the Milk Sales item is associated
with that account (this is done in the Item setup window). Also, the
Milk:Sep class has been assigned to this transaction, to tag it as
part of September's production.

Updating Cow Numbers & Other Information
A couple steps are necessary prior to getting milk production
reports.
First, you import a copy of your QuickBooks lists (Accounts and
Classes) and transactions into ManagePLUS. (ManagePLUS automates the
process--it mostly involves selecting a few menu choices.)
Second, you associate some information with your accounts and
classes in ManagePLUS, as described below.
Accounts: Assigning a Unit of Measure
ManagePLUS gathers and reports quantity information only
for accounts to which you have assigned a unit of measure. So you
need to assign one to the account which represents milk sales
income. You do this in ManagePLUS, not in QuickBooks, and should
only need to do it once--ManagePLUS retains what you've entered,
unless you change the account name.
Here's part of the ManagePLUS Accounts window showing that
"lbs." (pounds) has been entered as a unit of measure for
the Sales:Milk Sales account (the line is highlighted in yellow in
the illustration).
ManagePLUS lets you assign any unit of measure you
want--hundredweight, kilograms, or whatever.
Classes: Updating Cow Numbers
ManagePLUS lets you associate units of production with individual
classes. This is what allows ManagePLUS reports to provide per-unit
(per-cow, in this case) statistics. This is a critical step;
something you'll always need to do before generating a report of
monthly production and a rolling averages.
For each subclass representing a month's milk sales (Jan, Feb,
Mar, etc.) you enter the average number of cows in the herd during
that month.
For the parent class, Milk, you enter the average number
of cows in the herd over all of the months represented by your
transactions--usually the most recent twelve month period, to
calculate a twelve-month rolling average.
Here's an example showing the ManagePLUS Class list with the
monthly and twelve-month average cow herd numbers in place:
Maintaining these numbers in ManagePLUS is easy. Each month you
just enter a new number for the lead month (the most recent
month)--cow numbers for the other months don't change. Then you
update the average number of cows for the entire (usually
twelve-month) period, by changing the number associated with the
Milk class.
For example, suppose you've just finished entering the last milk
check for July. Before printing a twelve-month rolling average
report which includes July's production, you update the number of
cows for the Milk:Jul class, and leave the other month's numbers
alone. Then, you update the number of cows associated with the Milk
parent class. (Use a calculator to add up the cow numbers associated
with each of the twelve months' subclasses, and divide by twelve.)
IMPORTANT! Remember to update the number
of cows associated with the parent class (Milk in this
example) whenever you change cow numbers associated with an
individual month. If you forget this, your monthly numbers (and
monthly production statistics) may be correct but the rolling
average won't be--it will be based on the wrong number of cows.
Getting Reports
With your transactions imported into ManagePLUS and the updated
cow numbers in place in the Class list, you're ready to generate the
report. The ManagePLUS Profit & Loss report will provide the
best view of the rolling average statistics.
In ManagePLUS, choose Reports | Profit and Loss from the
main menu.
The Print Control window will open.
In the Print Control window click on the Filters button.
The Report Filters window will open.
In the Report Filters window, choose the Selected Dates
option.
Enter the desired date range in the From and To boxes.
This is a critical step...be sure you understand it!
Milk checks are often entered during a month other than the
production month they represent. Said differently, a transaction's
date has nothing to do with the "month" subclass you may
have assigned. So specifying a date range of, for example, 09/01/97
to 08/31/98 may not represent milk production from September
'97 through August '98. Some transactions entered during September
'97 may be for August '97 milk sales. Because the class
structure (the "month" subclasses) does not specify the
production year, those August '97 entries will be included in
August '98 production on your reports!
Note: you can bypass this problem by adding yet
another subclass level representing the production year. However,
doing this somewhat complicates both transaction entry and report
generation.
Click OK to close the Report Filters window and return to
the Print Control window.
Click on either the Print button or the Preview button to
print or preview the report.
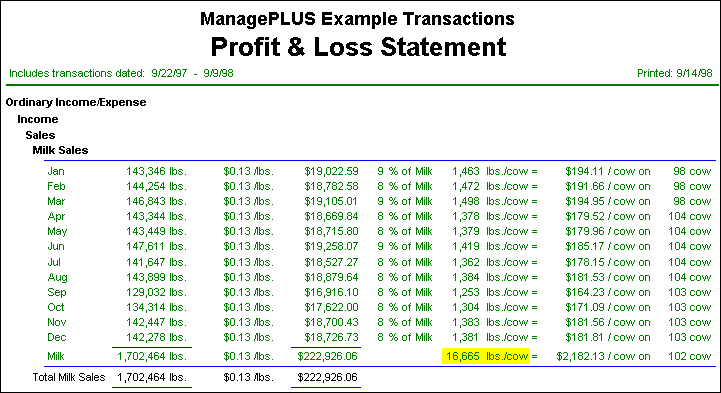
Here's the part of the report dealing with milk sales:

This report's columns, from left to right, show:
- The month
- Pounds of milk sold
- Price received per pound
- Dollars received
- Percentage of the parent class' dollar total
- Pounds of milk produced per cow
The whole-herd rolling average is highlighted in yellow (on
an actual ManagePLUS report it would not be highlighted)
- Gross milk sales (dollars) per cow
- Number of cows in the herd for that month or year
Notes:
-
This report fragment shows the month by month breakdown of milk
sales by class and subclass. If this section is missing from your
report, click on the Format button in the Print Control window
(after step 5, above) to open the Report Formatting window, and
place a check mark beside the Class Summaries option. Then Print
or Preview the report again.
-
You can change settings in the Report Formatting window to
include a list of the transactions on which the report is based
(place a check mark beside the Transaction Detail Rows option), or
to change the number of decimal places shown for numbers and
currency (change the Decimal Places For... settings).
-
One minor problem with the report is that the month subclasses
are printed in the same order as they are arranged in QuickBooks.
For this example it would have been better if they began with Aug
and ended with Sep, because that's the order of months in the
included transactions. (You can "fix" this problem by
rearranging the Classes list in QuickBooks before importing it
into ManagePLUS--but you'll have to do it before generating each
month's report.)
Final Comments
A couple more points to consider...
-
Besides getting milk sales information, don't forget that using
classes in expense transactions lets ManagePLUS provide
statistics on things like feed and veterinary costs per head
and per pound of milk sold.
-
Because ManagePLUS supports entry of two pieces of quantity
information in QuickBooks, you can also keep track of other grade
or quality factors. For example, if you keep track of the butterfat
percentage in each of your milk sales entries, ManagePLUS
reports can show your herd's weighted average butterfat
percentage for any period of time.
For more information about weighted averages, search for
"weighted averages" in the ManagePLUS for QuickBooks
Help system.
Permitted uses of this copyrighted material:
This article may be copied and distributed for educational or commercial purposes so long as
all of these requirements
are met: (1) This article may not be distributed in whole or in
part in a machine- readable form (for
example, as a computer file or over a network or Internet connection). (2) The article must be distributed in its entirety and not
condensed or abridged. (3) The copyright notice which appears at the bottom
of
this page must be included on every distributed copy of the article and
must be clearly readable. (4) No fee of any kind may ever be charged for this article or for any larger volume of which
it is a part. However, this article may be distributed as handout material at a
meeting or conference for which attendees have paid a fee, so long as no
separate fee is charged for this article or any larger volume of which it is a
part. (5)
All other uses require express written permission from Flagship Technologies, Inc.
Essentially, these requirements mean you may distribute
printed copies of this
article, so long
as each copy clearly bears our copyright notice and no fee is ever charged for such
copies.