The Transactions window has yet another toolbar below its standard data window toolbar, which offers the following commands.
![]()
Buttons
Here are descriptions of this sub-toolbar's commands and features.
|
Show group levels |
Displays the Show Group Levels menu which has commands for expanding/collapsing grid groups. |
|
Date grouping method |
Clicking the down arrow in this box lets you select the date grouping method ManagePLUS will use when you group the grid by the Date column. The example at left reads "by Month", which means that grouping the grid by the Date column will group transactions by month. The date choices include: Year, Quarter, Month, Week, and Day. This item has no effect, except when the grid is grouped by the Date column. |
|
Ungroup all |
Removes all grouping (removes all column headings from the grouping panel). |
|
Ungroup last |
Reduces grouping by removing the last (rightmost) column heading from the grouping panel. |
|
Remove filtering |
Turns off all filtering currently in effect in the grid, so that all transactions for the active accounting period are displayed. See also: the Record count indicator, described below. |
|
Show Column Chooser |
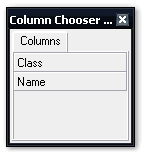
Toggles display of the Column Chooser, and example of which is shown below. You may drag column headings to/from the Column Chooser to hide/show them, respectively, in the grid.
|
|
Best fit current column |
If you've clicked in the grid so that a cell is selected (highlighted), then clicking this button will resize the selected cell's column to be just wide enough to show all data. |
|
Best fit all columns |
Resizes all visible grid columns so that all are wide enough to show the data they contain. |
|
Record count indicator |
This indicator is tells how many transaction records are currently visible in the grid. If you have filtered the grid in any way, so that fewer than the number of available records are shown, this indicator also displays "(filtered)" to let you know that a filtering is in effect. |
See also:
