This topic is here in the Reports Reference section, because the Transactions window actually supports many information/reporting needs quickly and flexibly, without the need to actually prepare a separate report.
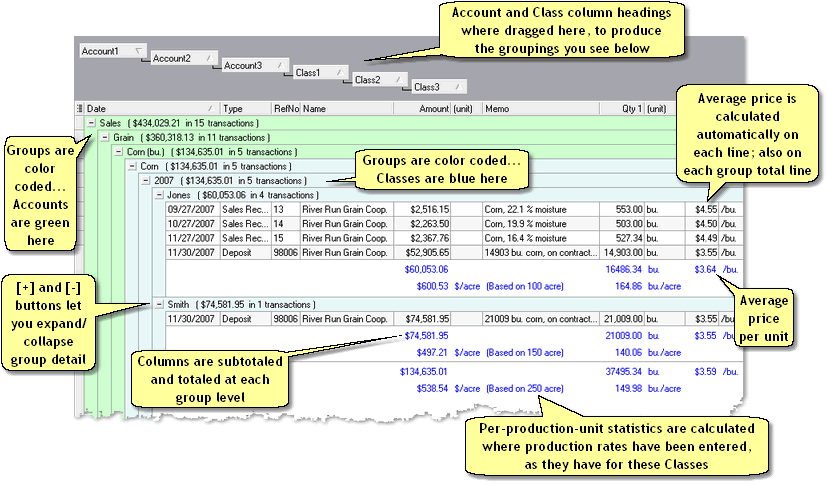
Here's a screen shot of the Transactions window, grouped by Account and by Class. Notice that the footer area for each group shows group totals for dollar amounts and quantities, as well as per-management-quantity-unit statistics. All that was necessary to achieve this result was to drag the Account and Class column headings into the grouping panel at the top of the window.

Basics
Accessing it
| • | Open the Transactions window by clicking on the Trans' (Transactions) button in the toolbar, then use the window's visual controls as described below. |
Using it
| • | Use the window's features to group, sort, and filter transactions to get at the information you want. For details, see the Quick Start Basics topic Using grid features to view transactions |
| • | You can use the toolbar's expand/collapse button menu to expand or collapse whole branches of the grid, and use the [+] and [-] buttons in the grid to expand or collapse individual sections. See Using ManagePLUS grids. |
| • | After you have the window configured as you want, you may preview or print the window's contents by clicking the Print button in the toolbar. See the Quick Start Basics topic Creating and printing a report for general information on previewing and printing. |
Notes & Highlights
| • | The transactions window only shows transactions for the active accounting period. So if you want information for a wider or narrower range of dates you'll have to open a different accounting period. |
| • | If you want per-management-quantity statistics and don't see any, remember that they will only be present (1) if you have grouped transactions (by dragging column heading(s) into the grouping panel), and (2) if the columns you've grouped by have management quantities associated with them—see the Quick Start Basics lesson Adding management quantities (Classes list example). |
See also: