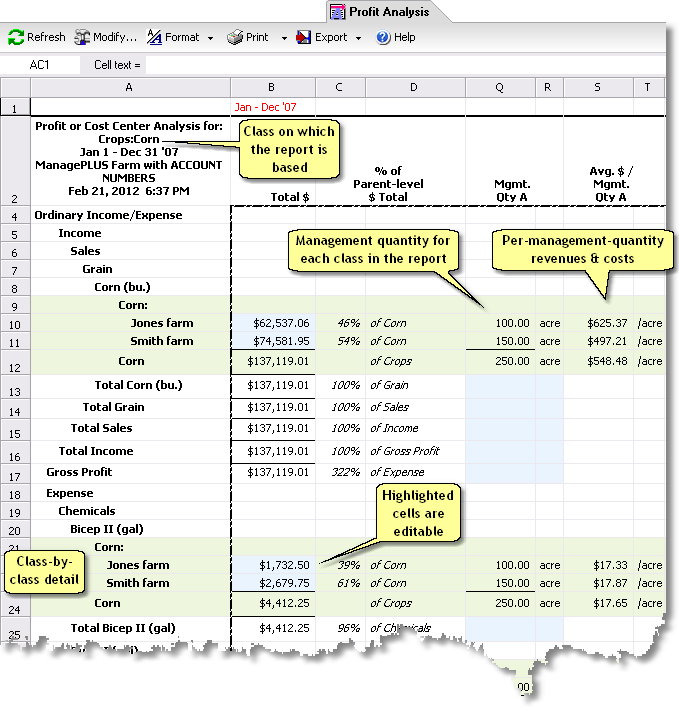
The Profit Analysis report (ManagePLUS Gold only) is essentially a Profit and Loss report for a single class (cost center or profit center), but including amounts allocated to that class from other accounts and classes.
Here's the top section of the report. It looks similar to the Profit and Loss with Classes report, but this report includes allocation transactions, while the Profit and Loss with Classes report does not.

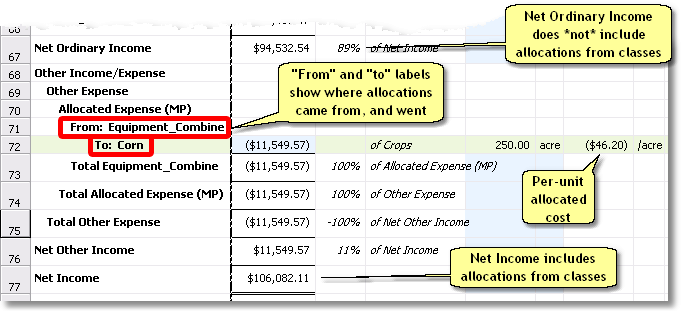
And here's the bottom section of the report, where class-to-class allocations are detailed. This simple example shows a single allocation, from the Equipment:Combine class to Crops:Corn. More typically, this section would include several allocations from various classes.

Basics
Accessing it
| • | From the Classes window: right-click on any cell of the class for which you want the report, then select Profit Analysis report from the pop-up menu. |
| • | From the main menu: select Reports > Profit Analysis. |
Using it
| • | To have quantity information (Qty 1, Qty 2) for any account in the report you must have entered at least one unit of measure for that account in the Chart of Accounts window. See the Working with the Chart of Accounts list topic in Tutorials, for details. |
| • | To have per-management-quantity-unit statistics on the report you must have supplied management quantities in the Classes window. See the Adding management quantities (Classes list example) topic in Tutorials for details. |
| • | To change the structure of the report, click on the Modify button in the report's toolbar. This opens the Modify Report dialog where you can choose which columns to include, change report titles, filter the data on which the report is based, and so on. |
| When you choose which columns display on a report, you are choosing the set of columns which will display by default when opening any new report of the same report type...until you change them again. |
| • | To change fonts, font sizes, colors, etc. on any part of the report, click on a cell within the area you want to change, then click on the Format button to display a list of report styles which you may edit. Select the style you want to edit, and the Edit Report Style dialog will open to let you make the desired changes. |
| A quicker way to access the same formatting options is to right-click on the cell. |
| • | You may edit some cells to test different scenarios of income and expenses, sale and expense quantities, and so on. (See Using reports for "what-if" analysis.) The editable cells are shown in the editable cells style, which by default has a light blue background. You can turn editable cells highlighting on/off with the Highlight editable cells option of the Format button menu. |
| • | Class information in the Main Report sheet comes from the Class Info sheet of the report. Click on its tab to access that sheet, where you can change the management quantities on which the report is based. |

| Changing management quantities on the Class Info sheet changes them for the current report only, and if you Refresh the report, your changes will be lost. A better way is to change management quantities at their source—in the Classes window or Chart of Accounts window—then refresh the report. That will rebuild the report using your changed management quantities, so that future report refreshes don't overwrite them. |
| • | To save a copy of the report as it currently exists—including any editing changes you may have made—you may export a copy to a Microsoft Excel file. Then if you want to work with the report again later, you can load it into Microsoft Excel or a compatible spreadsheet program. |
Notes & Highlights
| • | Tip: This report doesn't yet support "drill down" to see transaction details, but you can get details about any aspect of the report by using the grouping, filtering, and sorting features of the Transactions window. |
FAQ
"Why don't allocations from the Chart of Accounts window appear in Allocated Expense section?"
They're in the report, just not in the Allocation Expense block. Allocations made to classes from the Chart of Accounts window appear in their usual income or expense section of the report.
Why is that? Because allocating income and expense balances to classes in ManagePLUS Gold has exactly the same effect as making class assignments within QuickBooks transactions. And in fact, you may do both: you could assign some Electricity expense to classes in QuickBooks, then allocate the remainder of it (any Electricity amount not already assigned to a class) in ManagePLUS Gold. But if these two different assignments of Electricity expense to the same class showed up in different sections of the report—part in the upper (Expenses) section, and part in the Allocated Expense section—it would be very confusing.
So ManagePLUS Gold puts account-to-class allocations in their usual income and expense sections of the report, and only puts class-to-class allocations in the Allocated Expense section.
What's the difference between a Profit Analysis report and the (ManagePLUS) Profit and Loss with Classes report?
The Profit Analysis report differs in that it includes allocations, while the Profit and Loss with Classes report does not.
What's the difference between a Profit Analysis report and the (QuickBooks) Profit and Loss by Class report?
The QuickBooks report lists each class in separate column, so the report take up less vertical space but more horizontal space.
The ManagePLUS Gold report lists each class on a separate line below each account, so the report takes up less horizontal space but more vertical space. But in addition, it does some "behind the scenes" things to provide enhanced detail about the sources and destinations of allocations between classes; something QuickBooks reports cannot do.
See also:
Working with Reports in How-To Procedures
Working with Cost Centers, Profit Centers, and Allocation in How-To Procedures
Adding management quantities (Classes list example) in Quick Start Basics
Getting a Profit Analysis report in the tutorials